Wuhan— Air Quality Improvement under COVID-19, Visualized
Thank you for your big interest in the initiative “Air Quality Improvement under COVID-19, Visualized”. Comment down below if you want to have your city’s air pollution quantified and visualized! One of the most anticipated, #Wuhan, is now here!
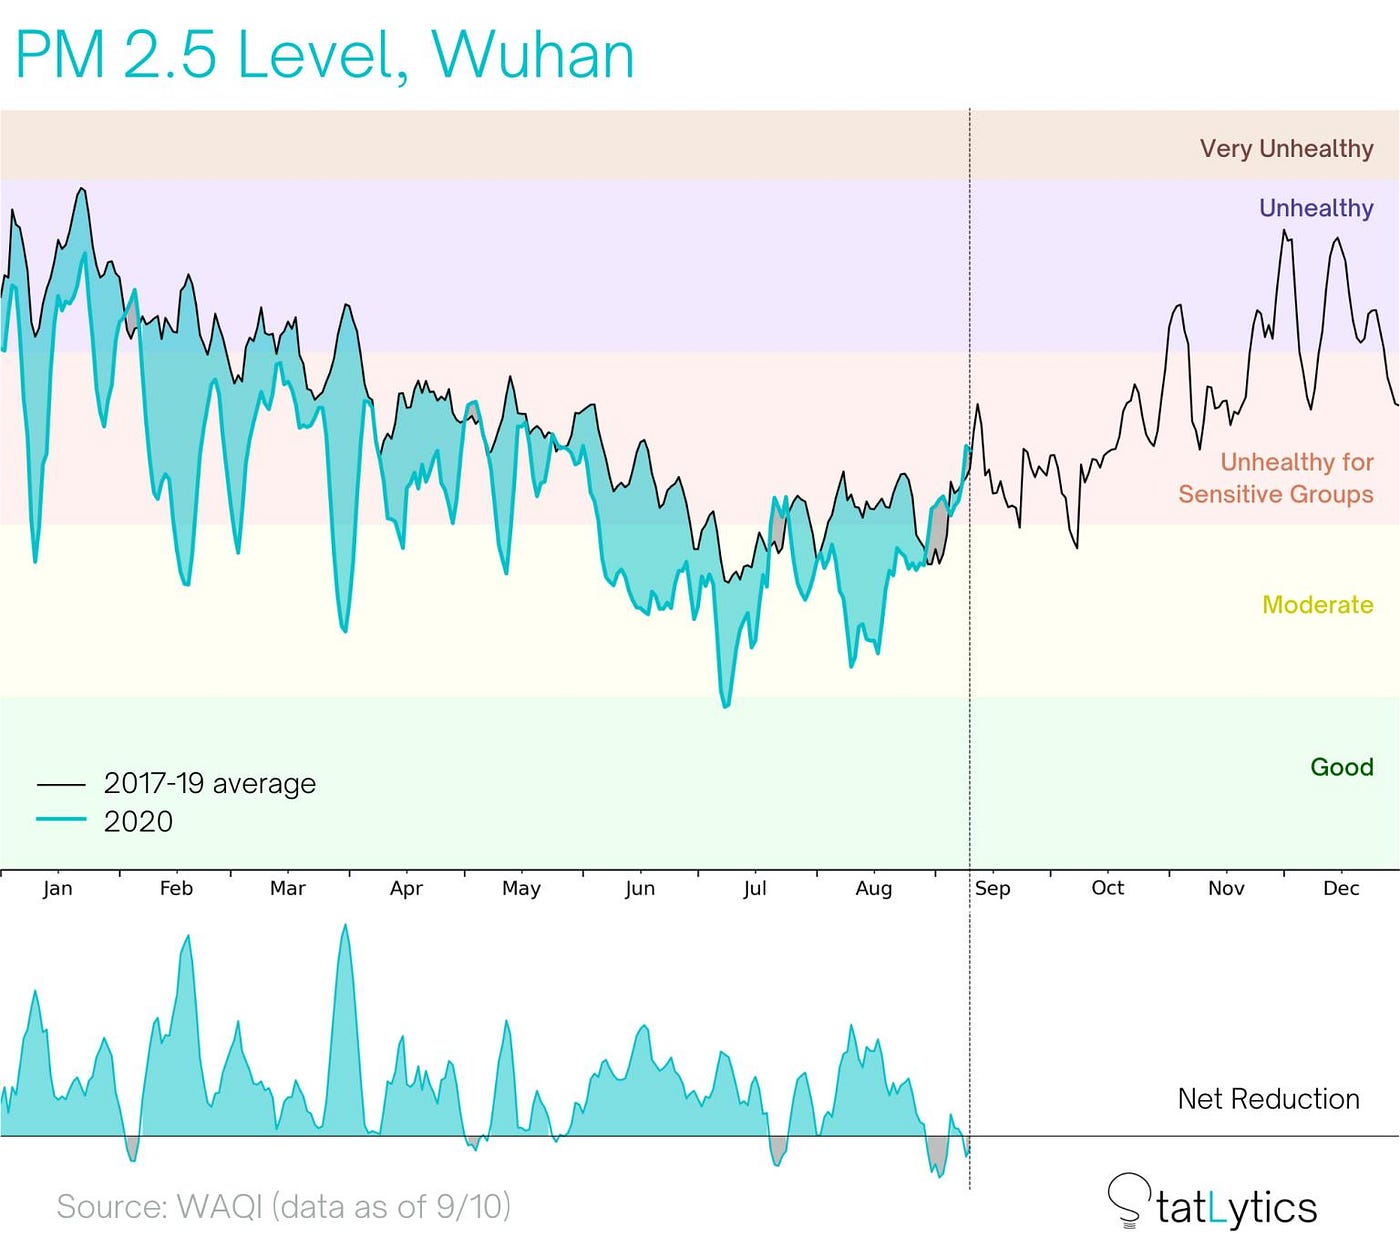
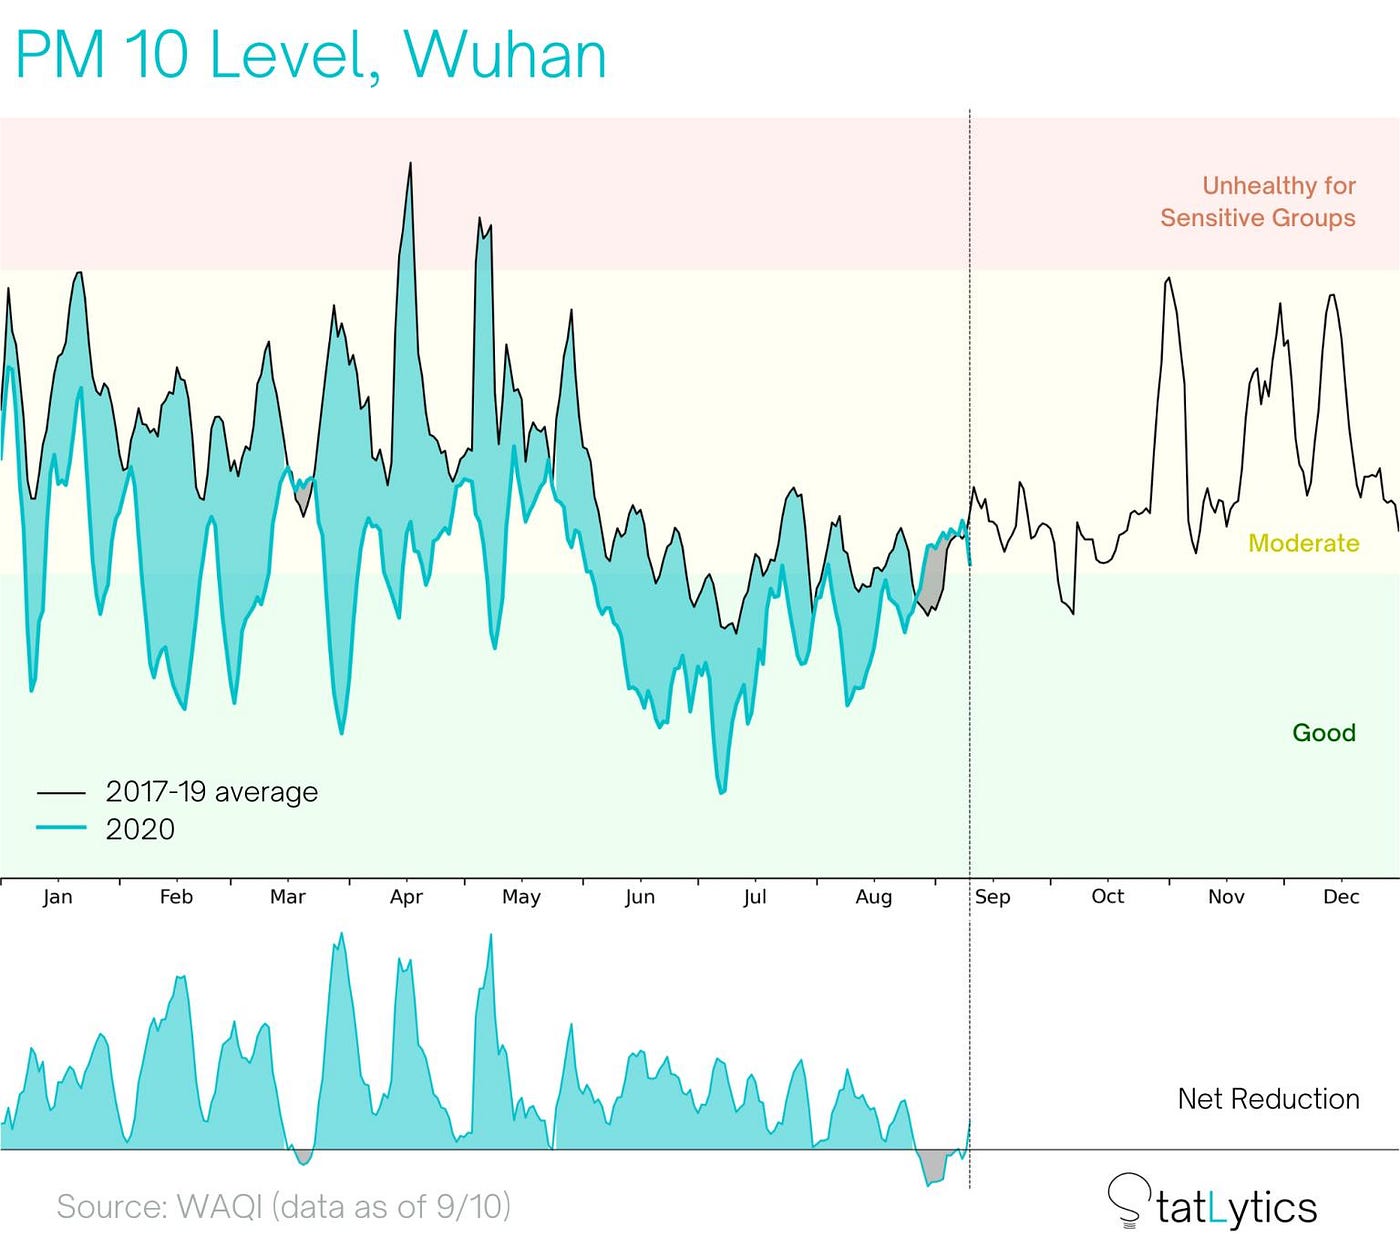
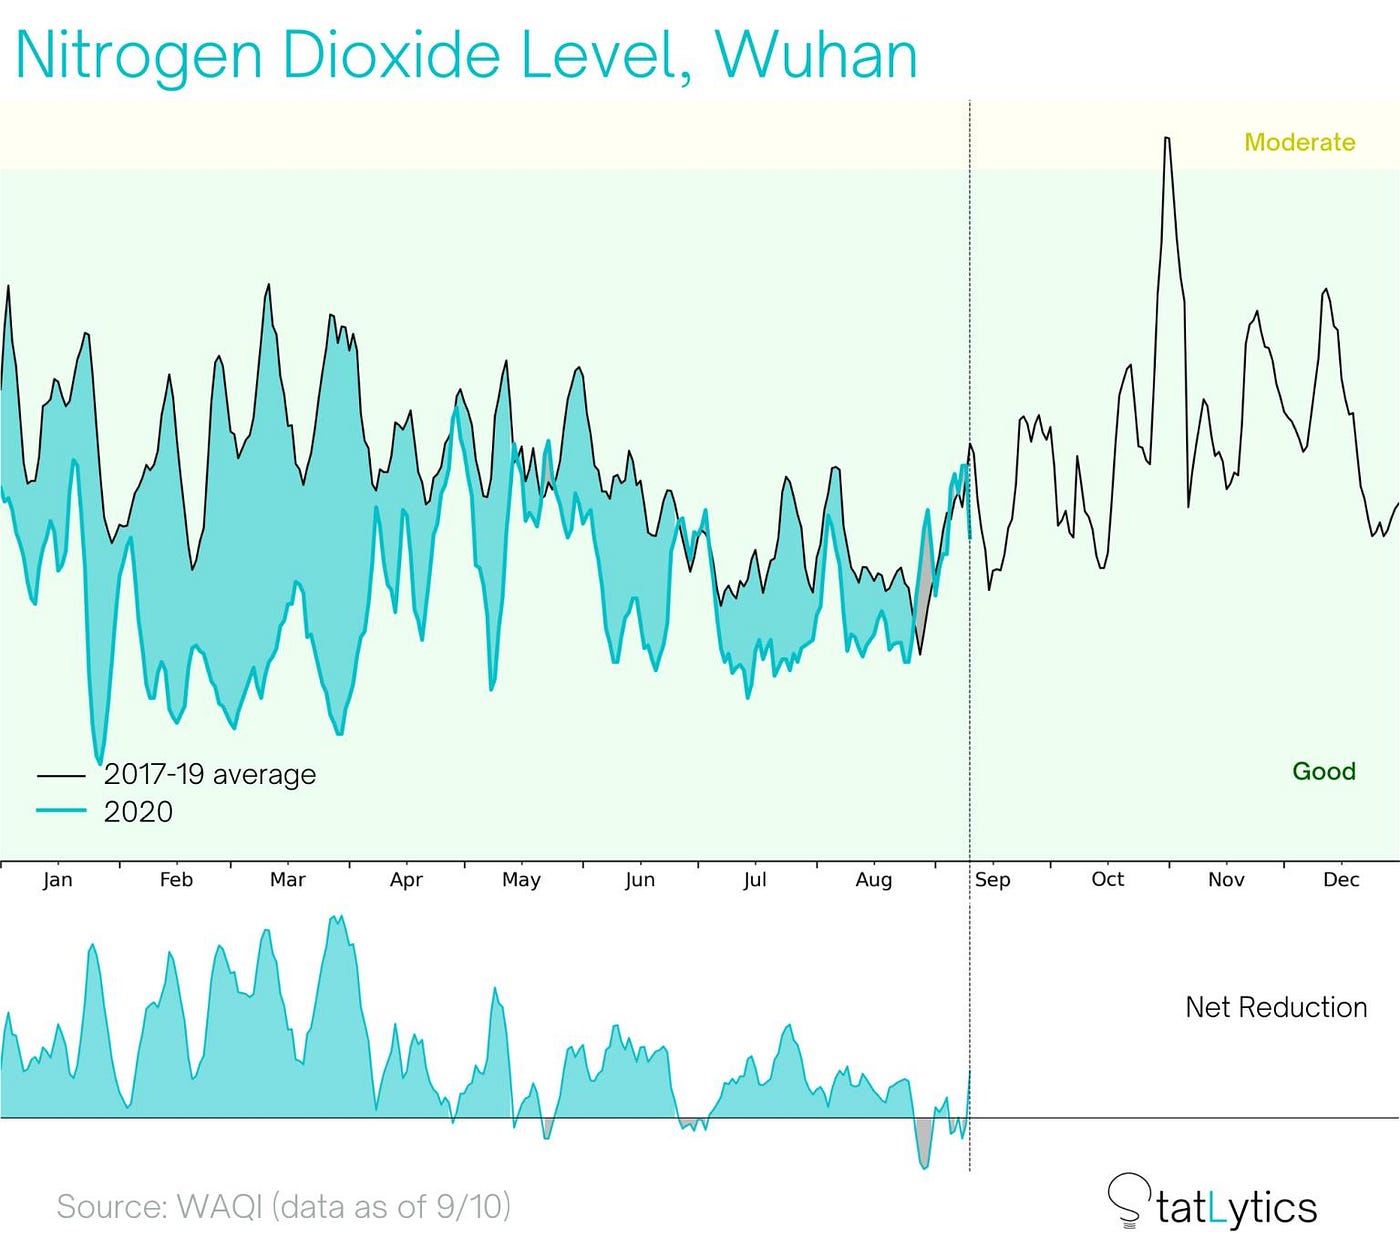
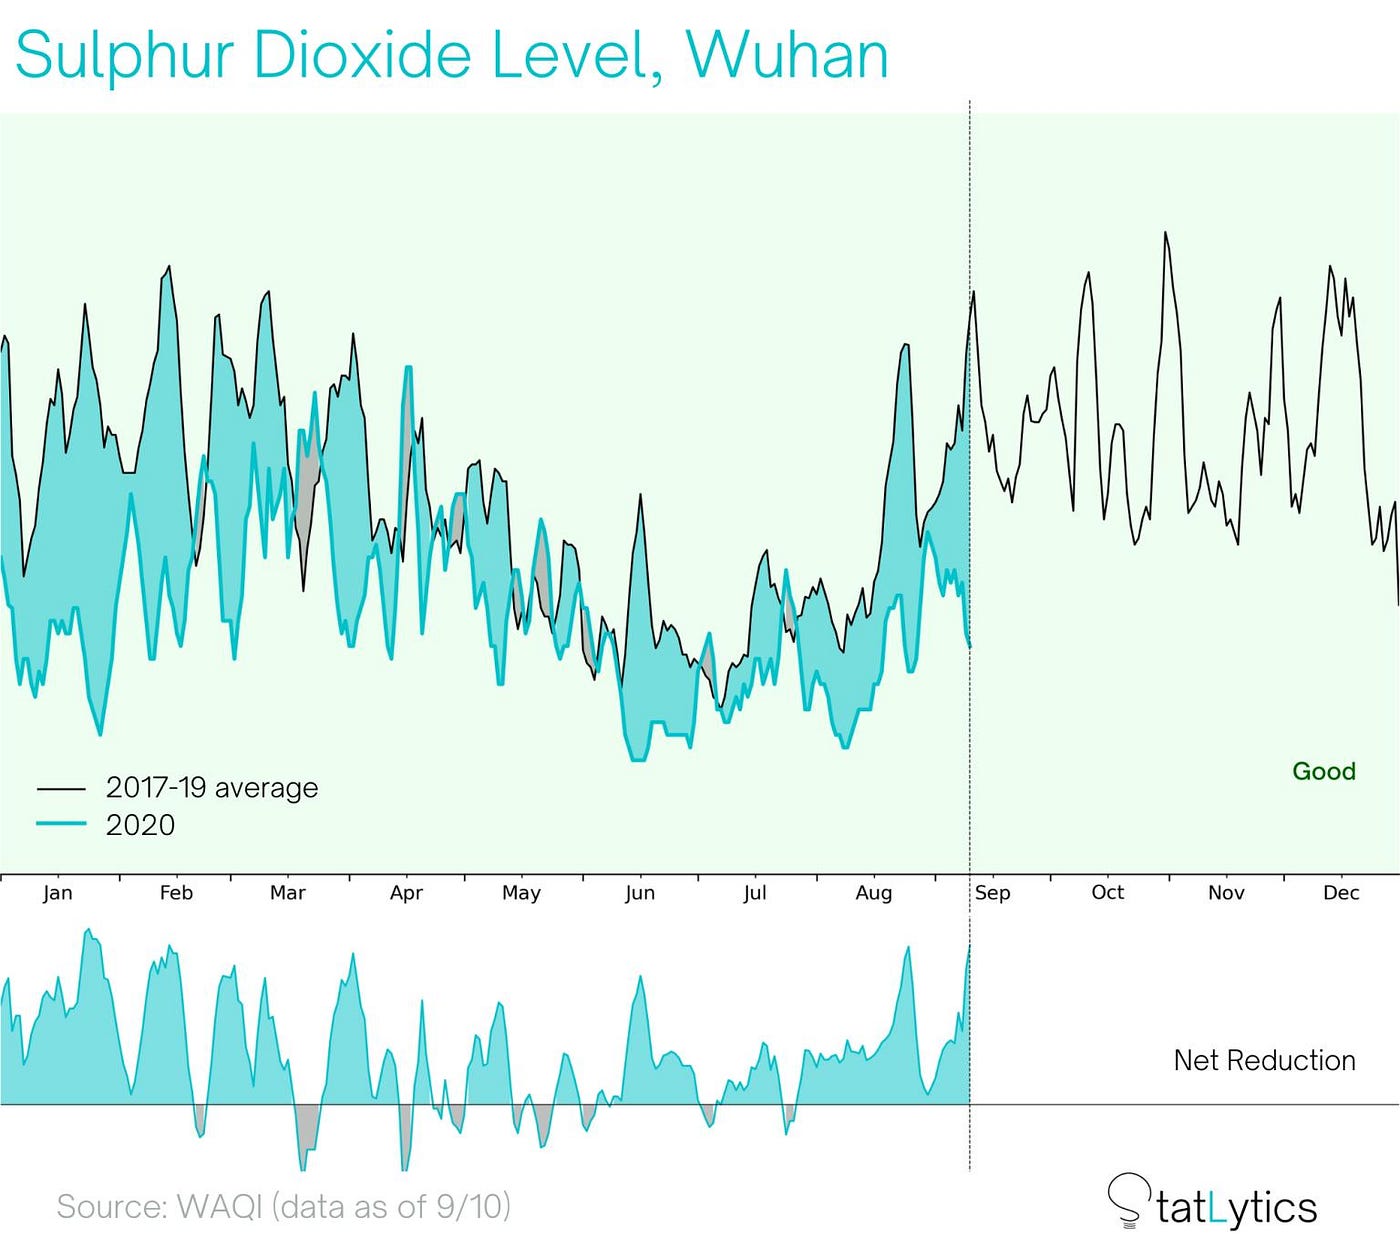
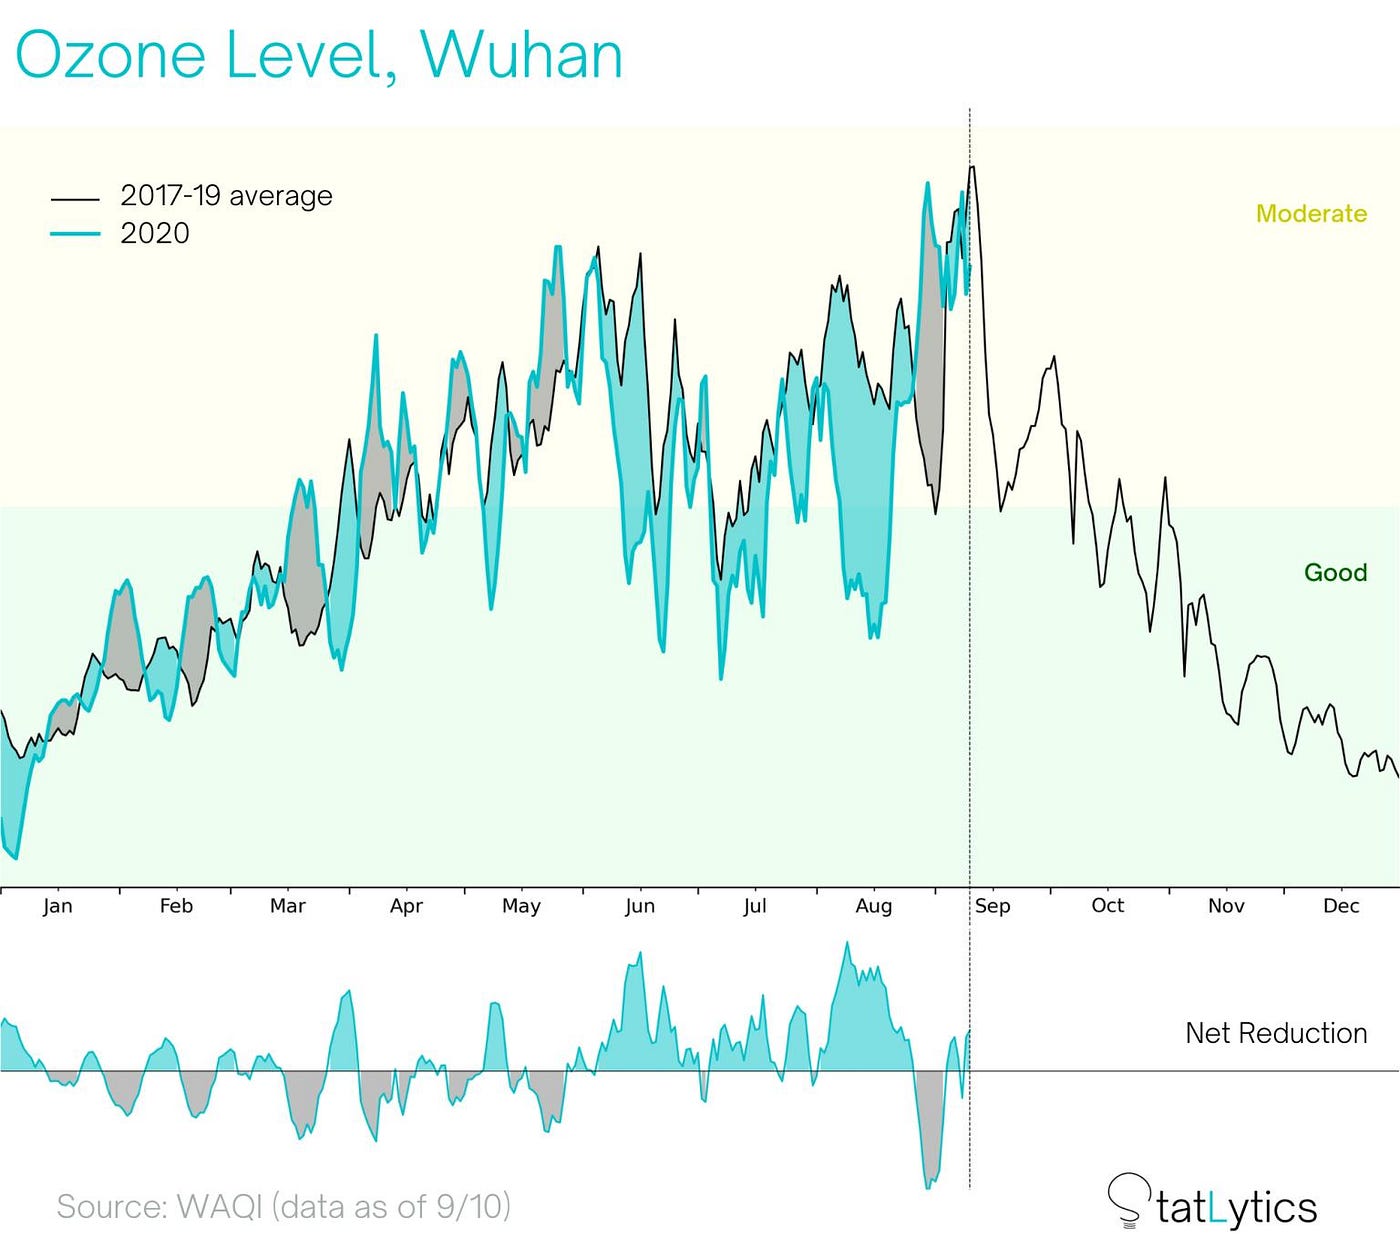
Not surprisingly, as the first COVID outbreak city, #Wuhan has its air pollutants lower than average since mid-January, as opposed to mid-March for most other cities. While their air pollution remained less serious for Jan-Apr, the pollutant margin between this year and previous years started to narrow down for since late May, indicating the recovery of industrial production has slowly started.
#Wuhan air pollution is definitely a good indicator of China’s overall level of industrial production, given Wuhan houses country-leading companies and factories in Automotive industry, Iron & steel industry and Manufacturing industry.
Thanks for reading! Give us a like and comment if you want more #infographics from us! Follow us to get the latest #MarketNews and our #DataInsights!