Some thoughts.
 Mar 15, 2021Business & Innovation
Online Experiments and Company Success
This piece writes on the summary and a short reflection on the article “The Surprising Power of Online Experiments” by Harvard Business School.
 Mar 7, 2021Business & Innovation
Are you now working in a design-centric environment? How can you benefit from having one?
This piece writes on the summary and a short reflection on the article “Design Thinking Comes of Ages” by Harvard Business School.
 Feb 15, 2021Business & Innovation
How and why you will fail with your past successes?
This piece writes on the summary and a short reflection on the article “The CEO’s Role in Business Model Reinvention” by Harvard Business School.
 Feb 14, 2021Air Quality Series
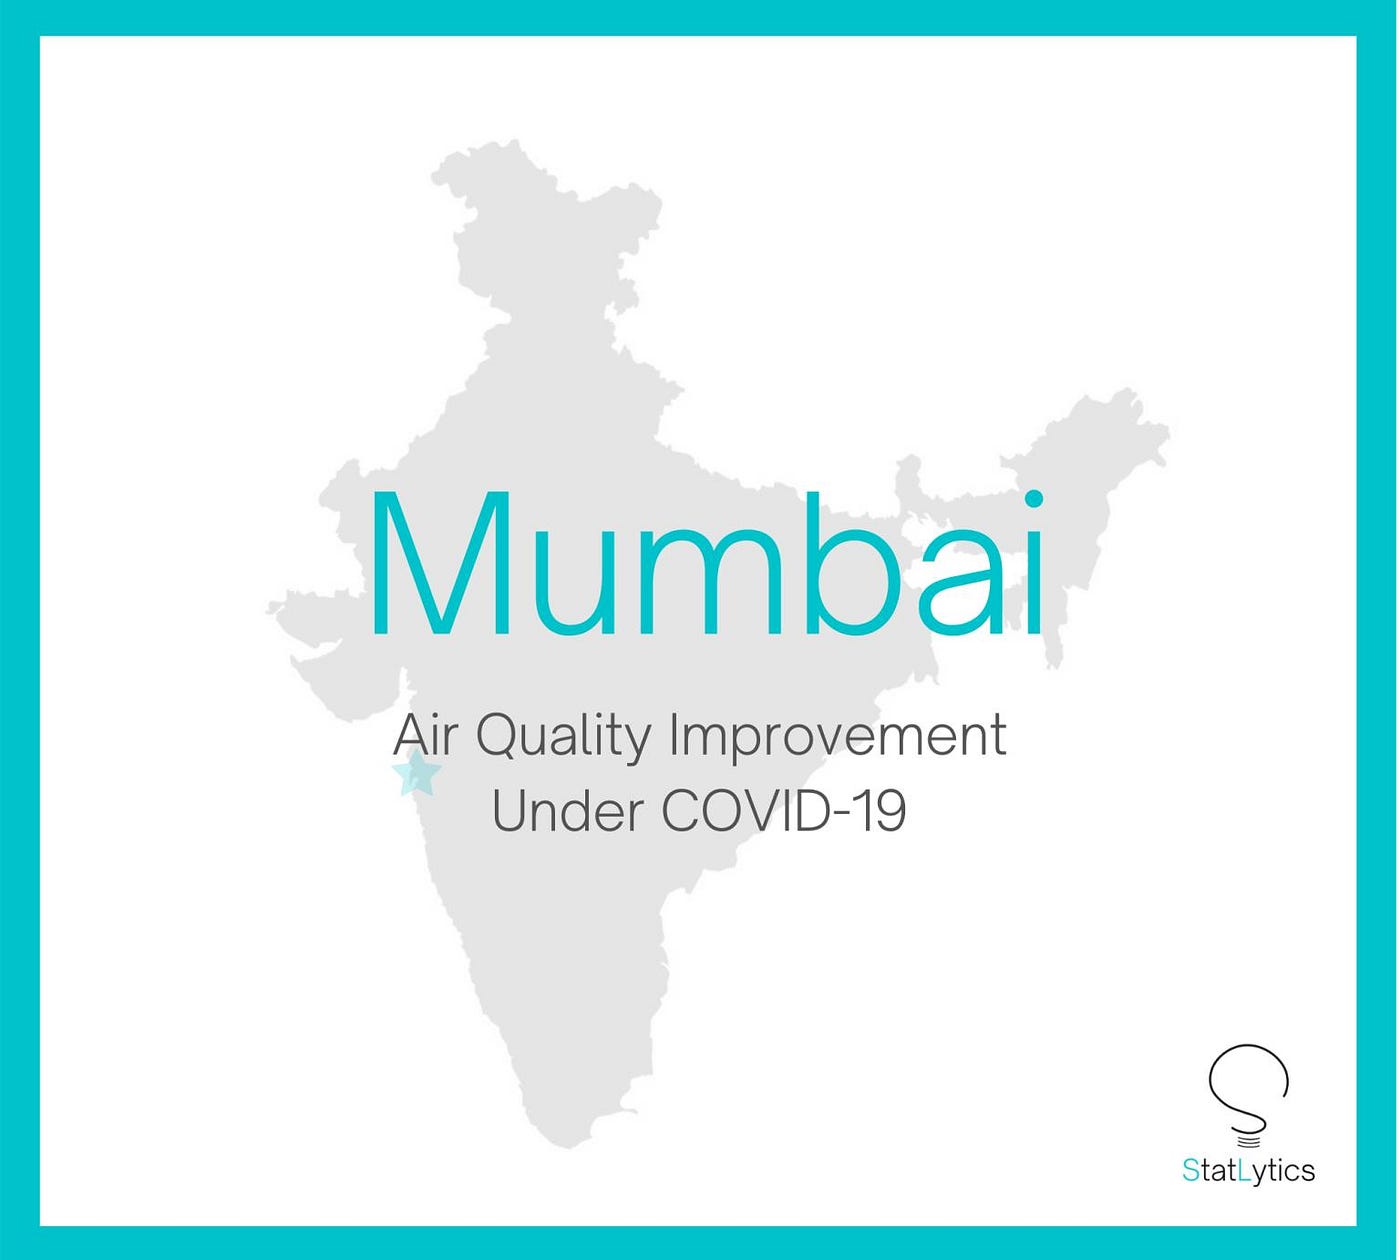
Mumbai— Air Quality Improvement under COVID-19, Visualized
“Air Quality Improvement under COVID-19, Visualized” initiative is available for #Mumbai, #India! Comment down below if you want to have your city’s air pollution quantified and vi
 Feb 7, 2021Business & Innovation
Manage innovations not only as processes, but also as a portfolio!
This piece writes on the summary and a short reflection on the article “Managing Your Innovation Portfolio” by Harvard Business School.
 Feb 3, 2021Data Stories
Much higher electricity bill during COVID-19?
No worries. You are not the only one.
 Feb 2, 2021Data Stories
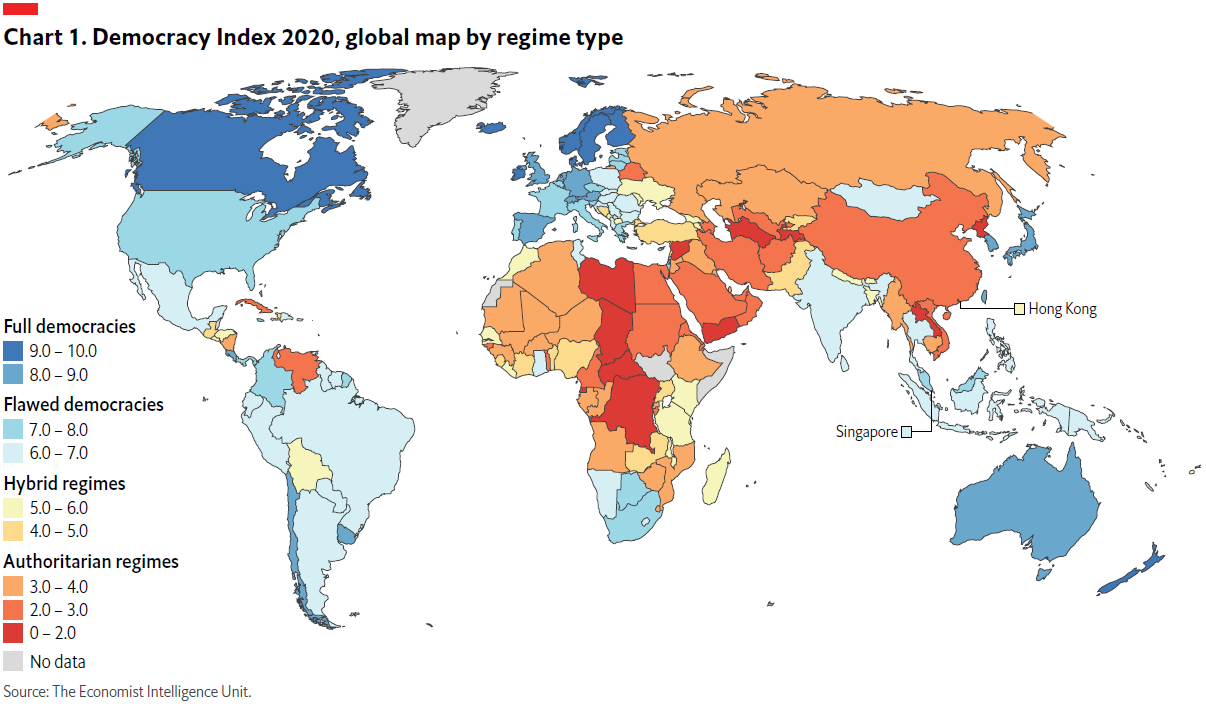
Democracy Index 2020 — Key Updates for East Asians
Democracy Index is published every year by The Economist Intelligence Unit (EIU). All data and statistics stated below are retrieved from the report “Democracy Index 2020: In Sickn
 Jan 31, 2021Air Quality Series
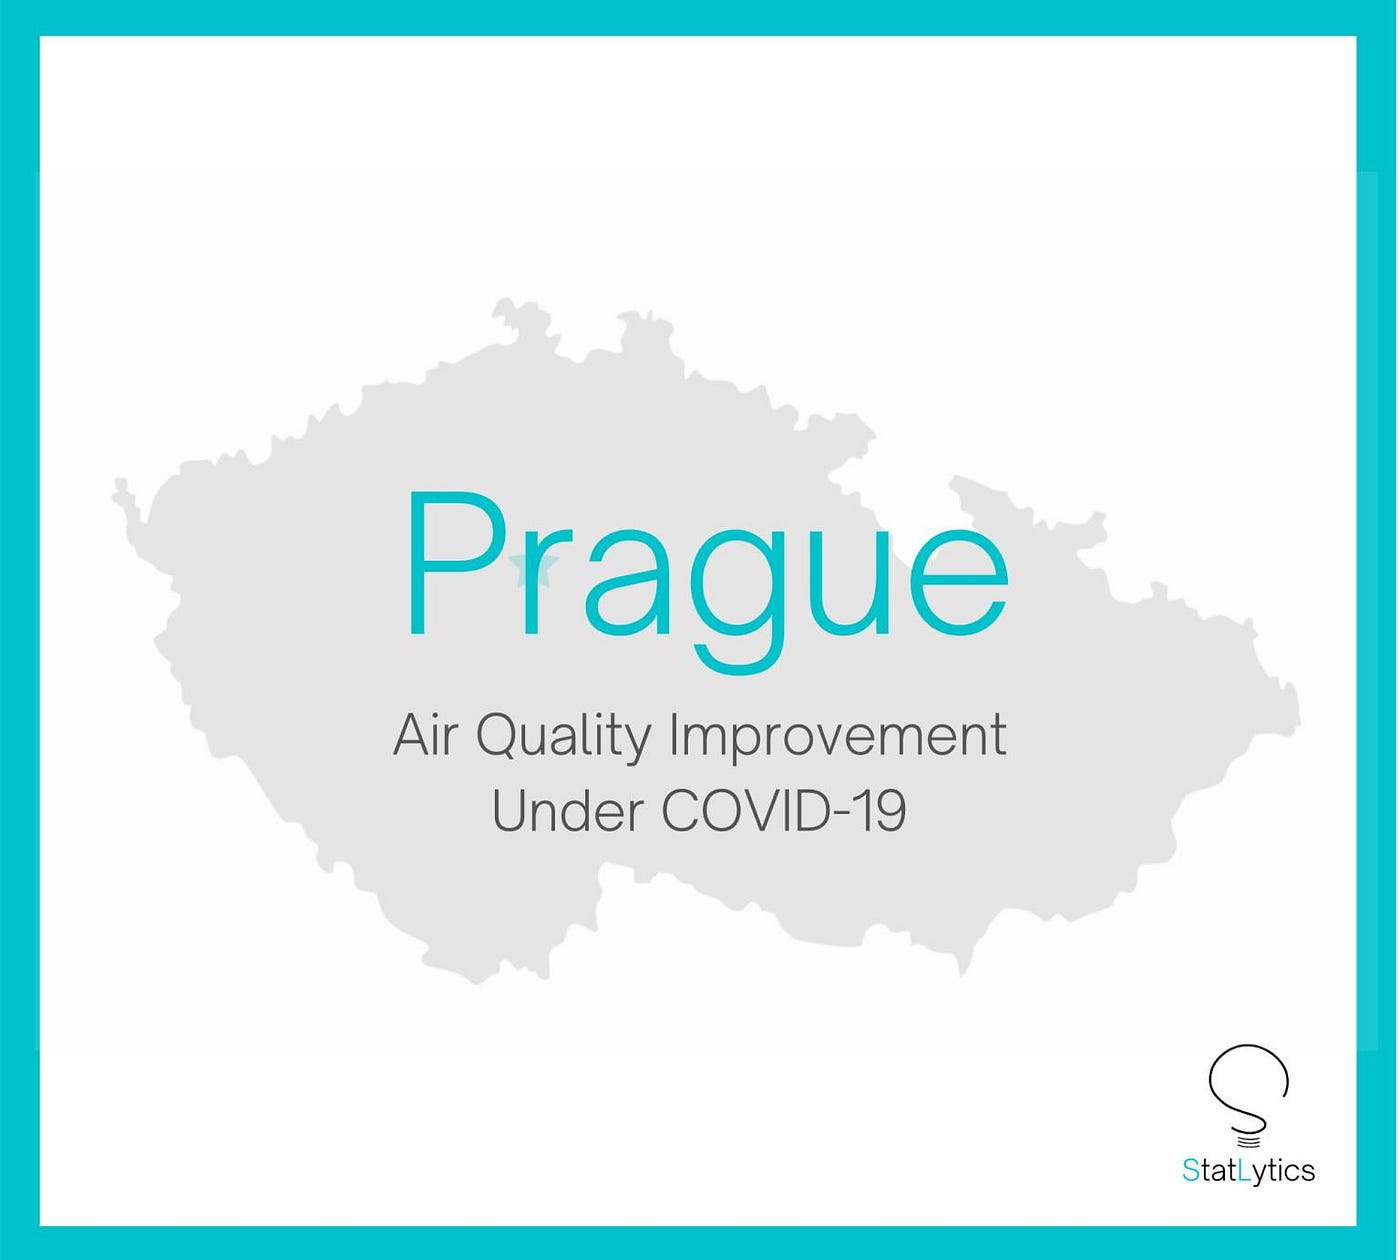
Prague — Air Quality Improvement under COVID-19, Visualized
Here you have #Prague, #CzechRepublic “Air Quality Improvement under COVID-19, Visualized” initiative! Comment down below if you want to have your city’s air pollution quantified a
 Jan 31, 2021Data Stories
HKUTEC Newsletter Volume 1 (January 2021 Issue)
 Jan 28, 2021Air Quality Series
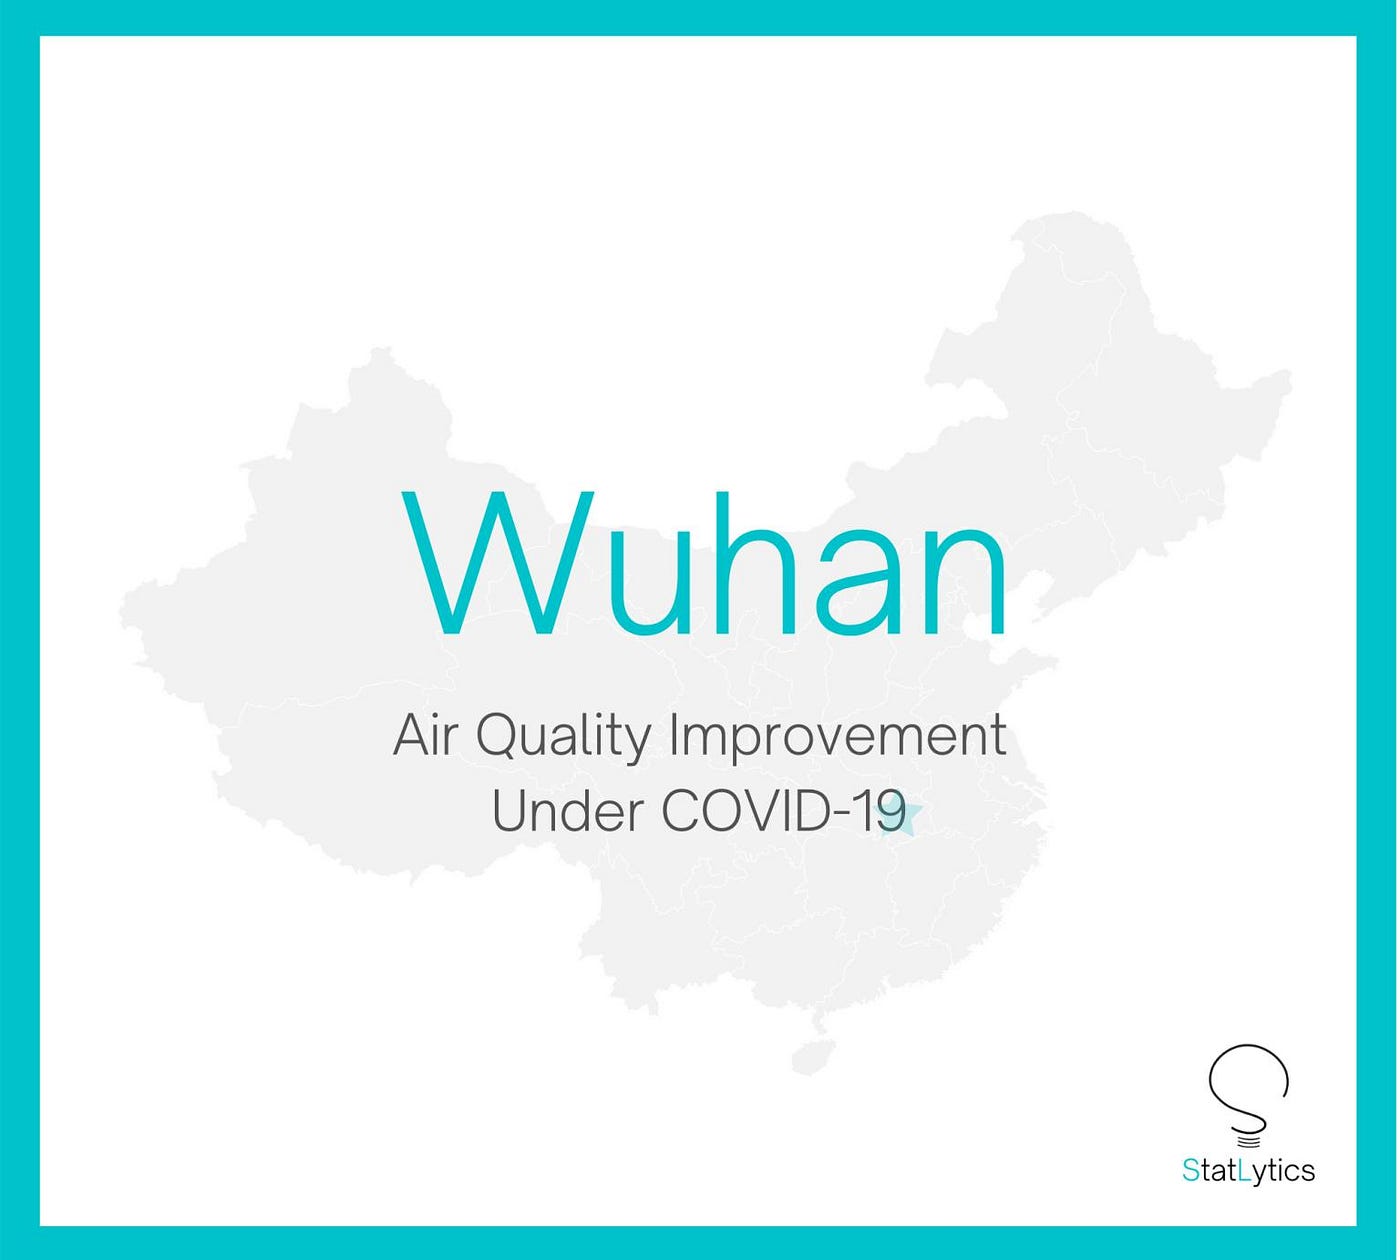
Wuhan— Air Quality Improvement under COVID-19, Visualized
Thank you for your big interest in the initiative “Air Quality Improvement under COVID-19, Visualized”. Comment down below if you want to have your city’s air pollution quantified
 Dec 7, 2020Air Quality Series
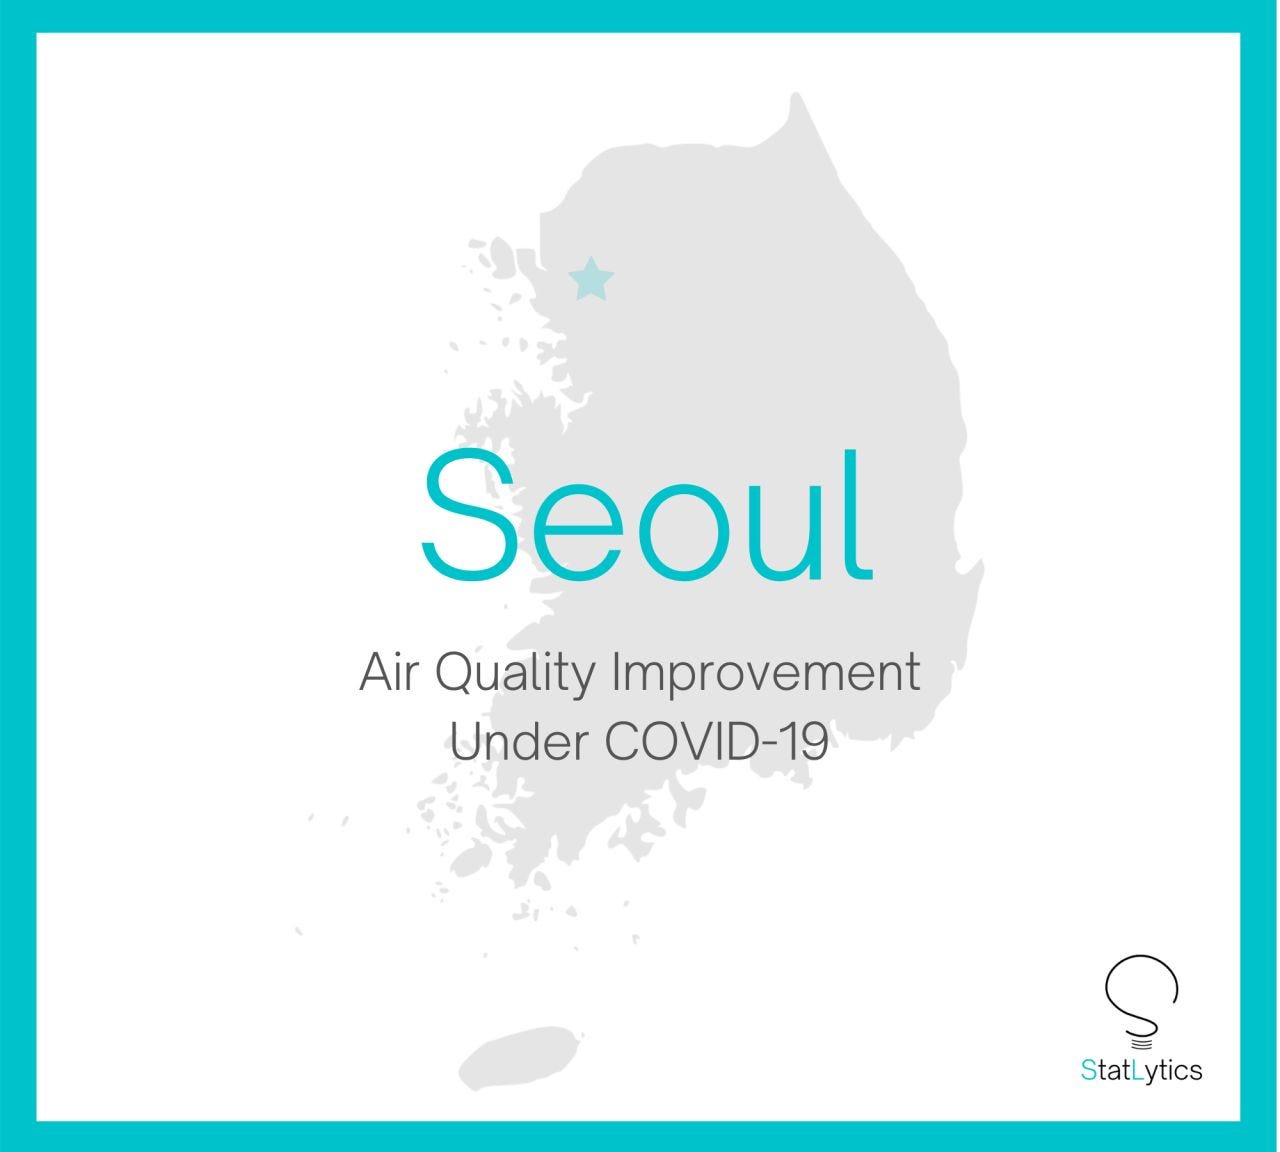
Seoul — Air Quality Improvement under COVID-19, Visualized
Here you are the “Air Quality Improvement under COVID-19, Visualized” for Seoul! Comment down below if you want to have your city’s air pollution quantified and visualized!
 Dec 6, 2020Data Stories
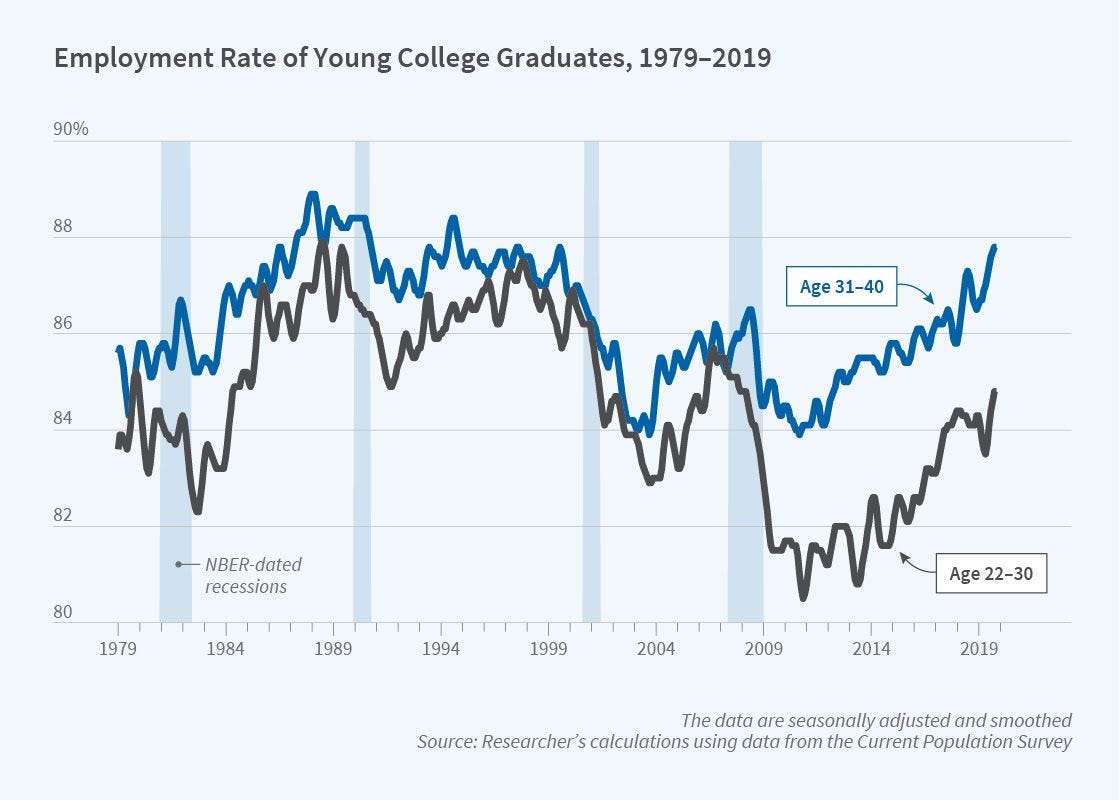
Highly Reduced Job Opportunities for Young College Graduates than 10 years ago
Employment has always been an issue in modern Economics. Job-finding rates and wages fell for new graduates entering the labor market in 2009 and 2010, but poorer prospects for you
 Dec 3, 2020Air Quality Series
Paris— Air Quality Improvement under COVID-19, Visualized
#Paris is now presented, with the initiative “Air Quality Improvement under COVID-19, Visualized”. Comment down below if you want to have your city’s air pollution quantified and v
 Dec 1, 2020Data Stories
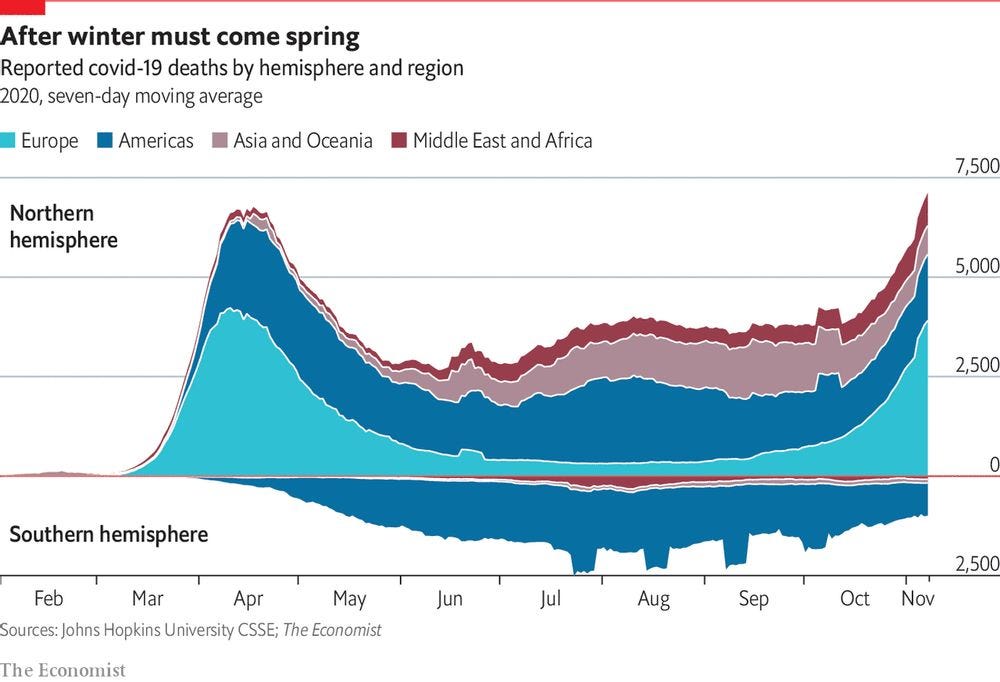
COVID-19 trend in Winter
A clear visuals comparing the trend in COVID cases, with a striking difference between Northern and Southern hemisphere. Low temperature seems to be a positive factor in spreading
 Nov 30, 2020Air Quality Series
Shanghai — Air Quality Improvement under COVID-19, Visualized
The “Air Quality Improvement under COVID-19, Visualized” is now available for Shanghai. Comment down below if you want to have your city’s air pollution quantified and visualized!
 Nov 29, 2020Data Stories
Insight Discovery from Credit Card Data — Corruption in China
With credit card transactions, along with other demographics and network information, we can discover and derive key insights.
 Nov 26, 2020Air Quality Series
Singapore — Air Quality Improvement under COVID-19, Visualized
The “Air Quality Improvement under COVID-19, Visualized” initiative of Singapore is now here! Comment down below if you want to have your city’s air pollution quantified and visual
 Nov 25, 2020Business & Innovation
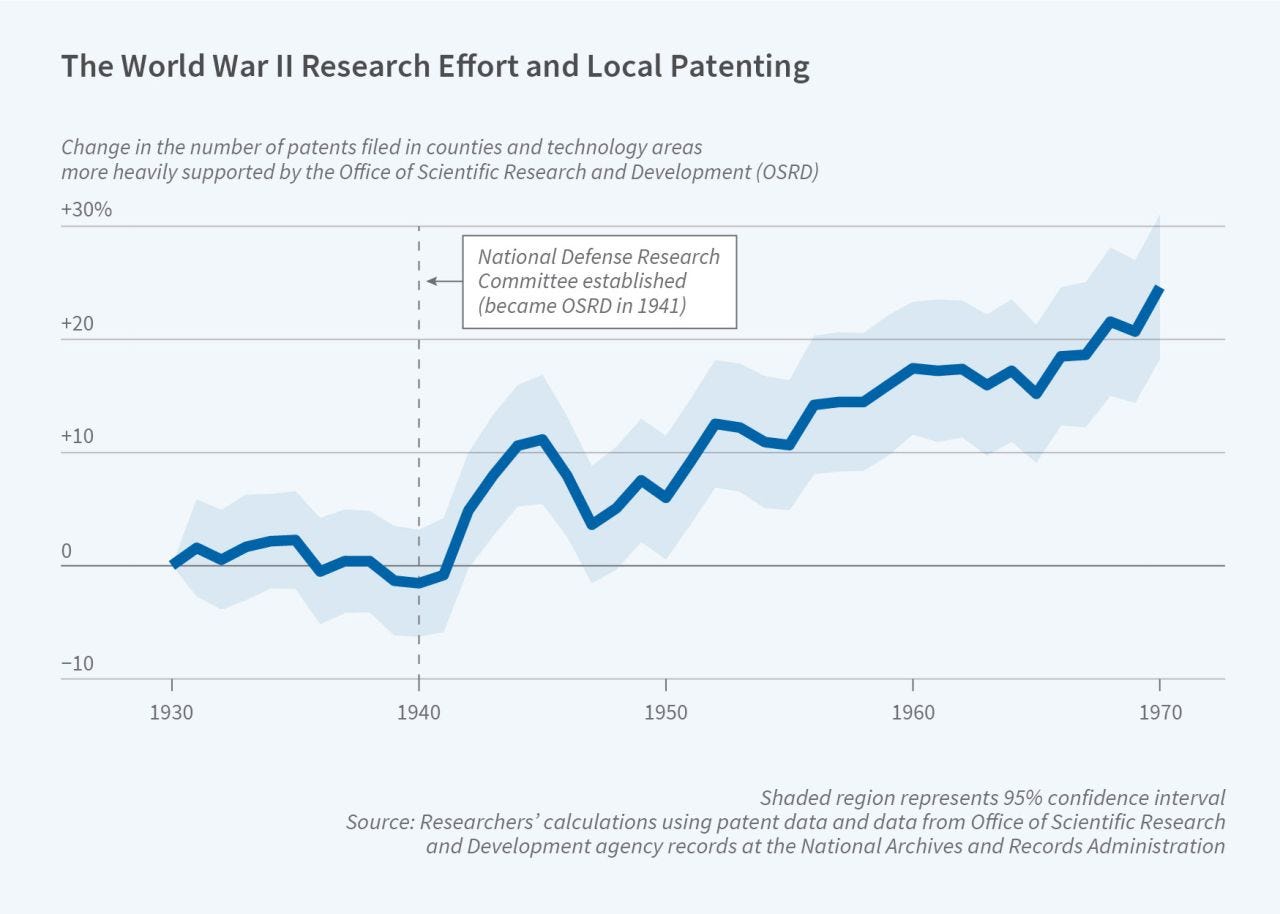
War and Innovation
U.S. federal support for research through funding and establishment of National Defense Research Committee during the World War II directly contributed to a surge in wartime patent
 Nov 24, 2020Air Quality Series
London — Air Quality Improvement under COVID-19, Visualized
The “Air Quality Improvement under COVID-19, Visualized” initiative now comes to London! Comment down below if you want to have your city’s air pollution visualized!
 Nov 23, 2020Business & Innovation
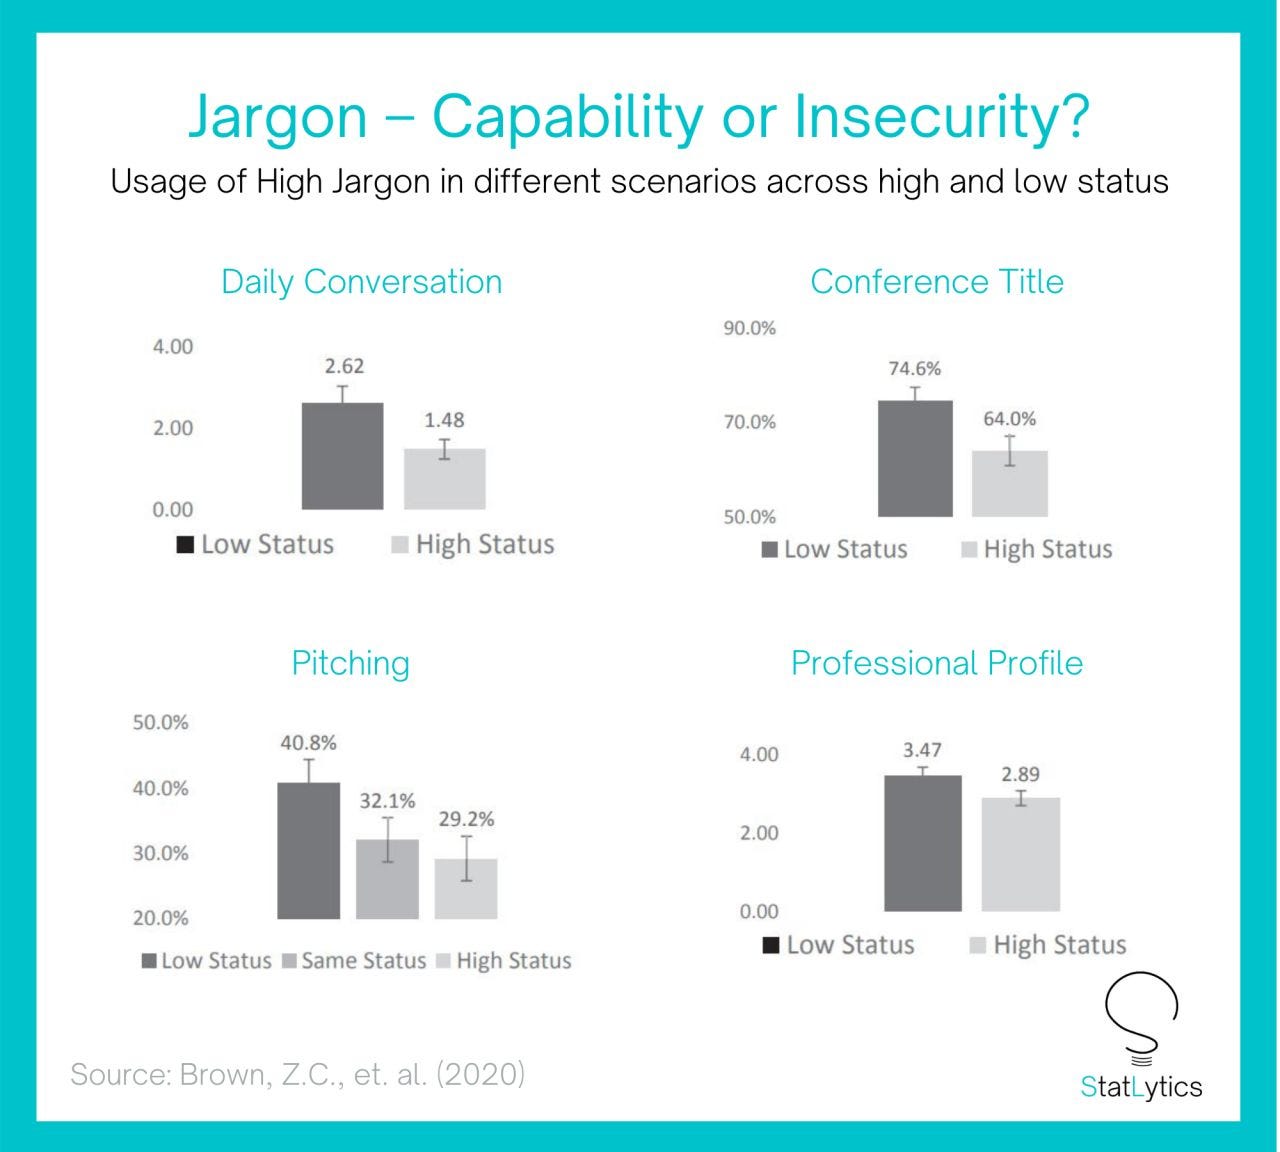
Is Jargon usage a sign of capability or insecurity?
Brown, et. el. (2020) suggested that it’s more an insecurity. People with relatively lower status tend to use more jargon in all occasions, ranging from daily conversations to prof
 Nov 22, 2020Air Quality Series
Beijing — Air Quality Improvement under COVID-19, Visualized
Thanks for you interest in the “Air Quality Improvement under COVID-19, Visualized” series! Here you are, the — Beijing — AQI change in the year!
 Nov 19, 2020Data Stories
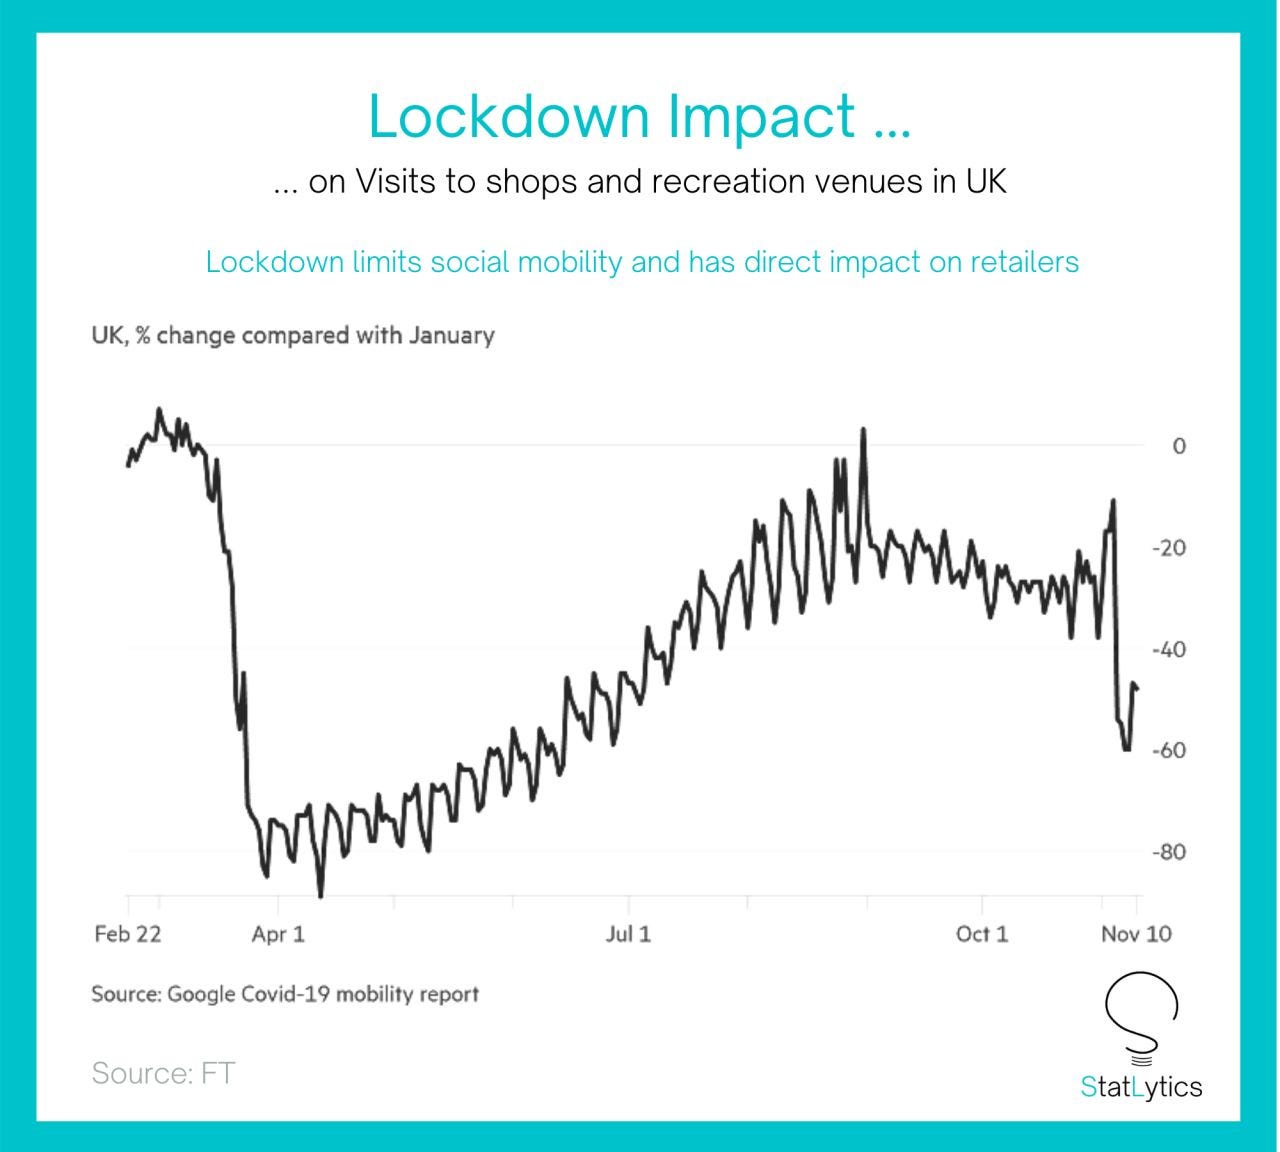
How your perception may have misled your thoughts over the economic impact on lockdown?
Lockdown could have less adverse impact that you thought, if you perceive through your personal experience.
 Nov 18, 2020Air Quality Series
Hong Kong — Air Quality Improvement under COVID-19, Visualized
Occasionally we would come across news on the positive environmental impact of COVID-19, but how big it is? To what extent have the air pollutants reduced during lockdown? I have v
 Nov 17, 2020Data Stories
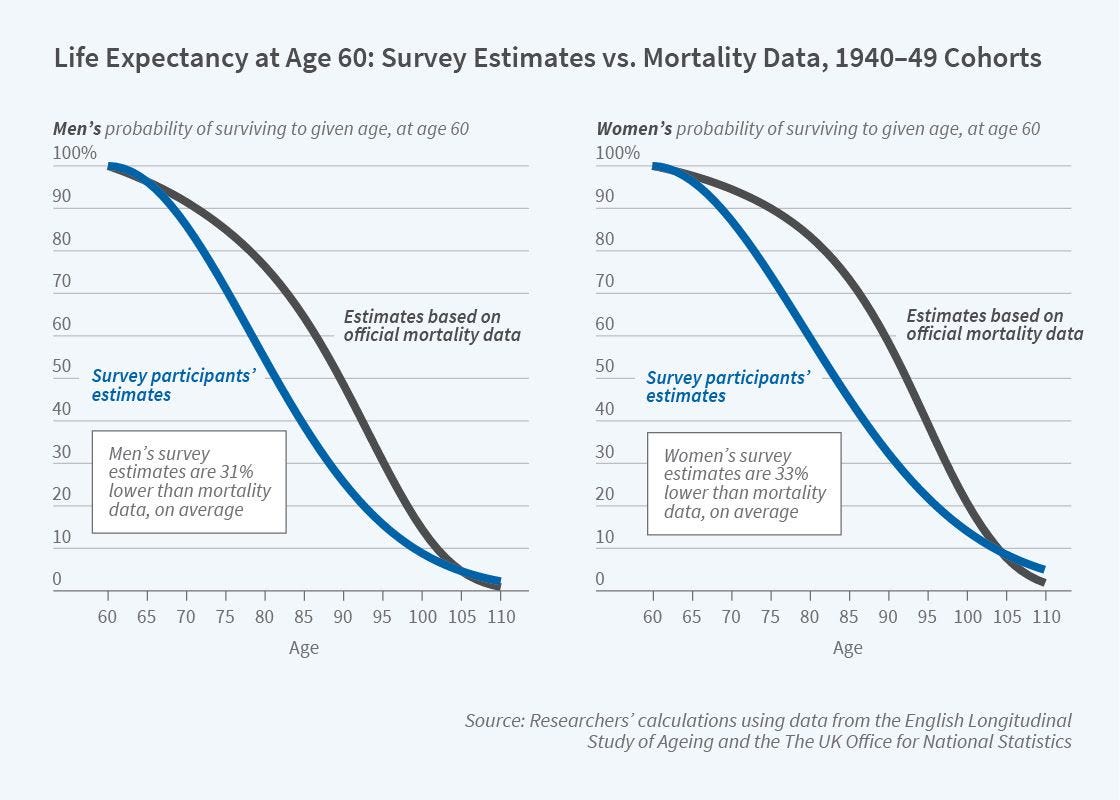
Did you underestimate your life expectancy?
A survey is conducted on people aged 60 for the attitude on their life expectancy, showing that they consistently *underestimate* their longevity, for both men and women. Researche
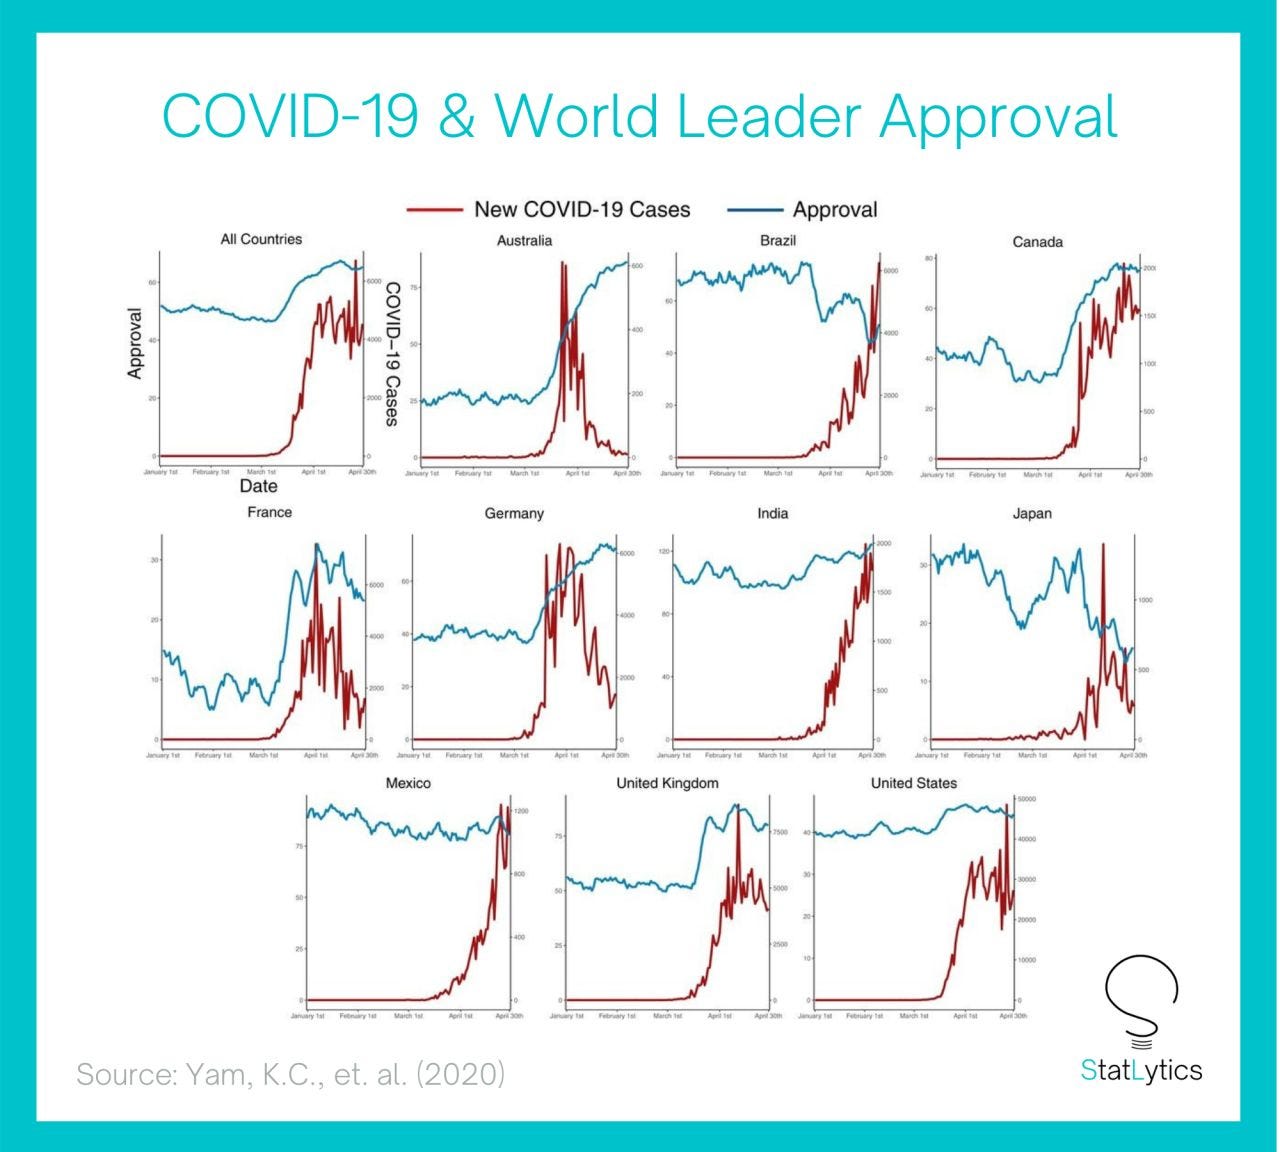 Nov 17, 2020Data Stories
How did the global COVID-19 pandemic affect the world’s leader approval rating?
How did the global COVID-19 pandemic affect the world’s leader approval rating? Your answer would probably be a negative impact.